
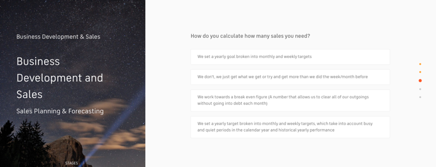
How do you want 2019 to be different?
If you’re like most business owners and sales professionals, you’ll be making progress on your sales strategy for 2019.
You’re probably under pressure to find a way of building a sustainable pipeline of year-round sales to ease your cashflow and grow your business.
You probably had the same objective at the start of 2018.
So what are you going to do different in 2019?
In this post, I share the whole process that I use to create successful sales strategies that made me a millionaire as an entrepreneur and that have helped the clients that I coach to deliver accelerated, sustained, and profitable business growth.
- Sales strategy vs sales tactics
- What are the key components of an effective sales strategy?
- 9 steps for creating your 2019 sales strategy
- Why your sales strategy needs to work hand-in-hand with your marketing and product strategies?
- Creating a successful sales strategy
- Getting your free sales strategy PDF
Sales strategy vs sales tactics
Had enough of the usual advice you get from online experts telling you to “use lead scoring” or “sell the end result"? These are tactics, not strategies. All great ideas but in isolation they aren’t going to help you grow your sales or your business.
There's a direct correlation between sales and revenue, so in delivering accelerated, sustained and profitable business growth, your sales strategy is critical.
In a competitive market where multiple providers are chasing the same customer, and those customers are more demanding than ever, a structured, systematic and sustainable sales strategy is more important than ever.
Sales is a science, therefore following a specific sequential series of actions in the creation of your sales strategy is essential. Think of it as your recipe for selling success.
What you need is a coherent sales strategy, and a clear plan. Not a list of the latest sales hacks to try, in the hope that something will work to help you meet your targets. Because they won’t, certainly not over the long term.
A structured and systematic approach to your sales will enable you to…
- Retain and maximise existing customer relationships
- Target and win new business
- 100% focus on the right customers
Looking for an easy way to improve your 2019 sales strategy for FREE?
Use The Business Growth Pathway™ Sales Strategy tool to identify key focus areas for your business in less than 30 minutes.
Get StartedWhat are the key components of an effective sales strategy?
There are six powerful, interlocking components of an effective sales strategy. By understanding and applying these 6 components as part of your sales strategy you will realise the specific, predictable results you want.

1. Sales Planning & Forecasting
Ensure there are ‘no surprises’ in your planning and forecasting through a top down and bottom up approach.
Learn more about sales planning & forecasting
2. Your Customer Classification Framework
A bullet-proof method of understanding which customers offer you the greatest potentiality for growth and therefore where you should be focusing your efforts and time in order to maximize and retain them.
Learn how to create your Customer Classification Framework
3. Your Proposition Matrix
Simply getting customers to buy more. One in three customers do not buy your complete range of products and services simply because they don’t know you offer them.
Your personalised proposition matrix will allow you to understand your current product penetration and give you a structured approach to maximization and increased retention.
Learn how to create your Proposition Matrix
4. Your Customer Contact Strategy
Through a deep-rooted understanding of your cost to serve model coupled with the insight of how your customers want to be contacted, you can design a commercially viable, proactive, customer contact strategy.
Learn how to create a customer contact strategy
5. Your Sales Map
Your personalised sales map will allow you to track the progress of sales from the point of lead generation right through to the point of conversion. This is critical to forecasting in real time.
Read our step-by-step guide to creating a sales map
6. Your Sales Funnel
Identifying your lead generation activities, which feed your sales pipeline, will help highlight what’s working and what isn’t.
Your sales funnel will also help capture any golden nuggets and ideas you may be missing which could create a torrent of quality opportunities for your business. (This is where you include your sales tactics!)
That’s a snapshot of each of the 6 components, now let’s look at each of them in detail as a series of sequential steps.

9 steps for creating your 2019 sales strategy
Step 1: Sales Planning
Sales targets should be stretching BUT achievable, because of the calculated strategy behind how you arrive at them.
In my experience, most businesses are poor at planning and forecasting. They default to a ‘top down’ approach based on two factors:
- the historical performance of the business over the last few years (‘We’ve grown roughly 10% year on year over the last three years, so let’s target sales with 10% growth again’) or
- the executive, or senior leadership have lofty growth ambitions for the business aligned to the 3- or 5-year plan and set a target which is cascaded to sales teams with the message ‘This is what you need to deliver’.
Now while top down planning is undoubtedly part of the sales planning process, these businesses are missing the other critical part, the scientific element: ‘bottom up’. The key to effective planning and forecasting is to adopt a top down/ bottom up approach, and allow the two ways of thinking to meet in the middle.
Now, there might be a gap or tension in the middle ground between the top down aspirations and what the bottom up approach is saying can realistically be delivered. However, it is better to have the discussion at the start of the year as part of a proactive planning discussion, than to have it when it usually happens in a business: three or six months into the year when you’re already scarily behind on the numbers, on the back foot, and trying to play catch up.
Understanding your numbers is imperative in your planning and forecasting so let’s work through the following example to bring this to life…
| The number (£s) in our example | |
| 1. Revenue last year | (100,000) |
| 2. 10% year-on-year attrition | (100,000) |
| 3. Adjusted position | 900,000 |
| 4. Forecast annuity/recurring revenue for new financial year | 500,000 |
| 5. Maximization of existing customers | 300,000 |
| 6. Forecast revenue line (point 4 plus point 5) | 800,000 |
| 7. Gap to just stand still as a business versus last year | (200,000) |
| 8. Aspirational goal of 10% growth this year | 100,000 |
| 9. Real gap (point 7 plus point 8) | (300,000) |
| 10. New Business Acquisition Target | 300,000 |
If I were coaching you with a revenue line last year of £1,000,000, the first question I would ask, in assessing where your focus should be this year is: ‘What is the natural customer attrition rate in your business?’
No matter how good you are at retention, there is always some attrition and that has to be factored in.
A low attrition rate demonstrates that you are good at retention, a high attrition rate tells you immediately where you have work to do.
Let’s say attrition is 10%. Right away, you know that of the £1,000,000 you achieved last year, you can only expect around £900,000 this year, based on that rate of attrition.
The second question: ‘How much of that revenue is locked in as annuity/recurring revenue, that will reappear this year?’ Let’s say you have £500,000 locked up in annuity revenue.
Okay, so the next question is: ‘What’s the potential for growth in the existing customer base?’ or put another way, ‘From your existing customer base, how much can you get them to spend more?’. Let’s say you acquired some new customers last year who are now going to deliver the full 12 months of revenue from the beginning of this year, and those customers are worth £300,000 in revenue.
Adding £300,000 to your £500,000 in annuity revenue gives you £800,000 in forecasted revenue for this year. With £800,000 in expected revenue from existing customers (spending more and retaining those you can), you know that your acquisition of new customers, has to deliver £200,000 just to stand still as a business and generate the same £1,000,000 revenue as last year.
If your goal is to deliver 10% growth this year on top of last year’s revenue achievement, you’ll need to bring in £300,000 of business through new customer acquisitions; £200,000 to close the gap and £100,000 to achieve the 10% growth.
Numbers don’t lie; they paint a real picture of reality. Do you really know your business reality? How effective is your sales planning & forecasting?

Step 2: Customer Classification
It’s often the case in organisations that 80% of revenue and profit comes from 20% of customers while the majority of customers (80%) deliver comparatively little revenue and profit. Similarly, 80% of sales may come from 20% of your products and services.
High value customers are great, but it opens you up to risk if you’re dependent on a small number of key relationships. If just one leaves it can really hurt your business and growth aspirations.
Your customer classification framework is designed to clarify and assess where you have risks and opportunities. It is designed as an internal tool, giving you key insights and intelligence for making informed decisions about how to grow your business. It should not be used externally with your customers.
Creating your Customer Classification Framework
First, categorise your customers into classification bands: Platinum, Gold, Silver, and Bronze, or Tier 1, 2, 3, and 4. It doesn’t matter which method you choose, only that there are clear classification bands. The classification is based on a customer’s spend over a 12-month calendar period aligned to the financial year of your business.
Let’s use an example to illustrate the framework in action…
A business in the technology industry with 210 clients. The overall revenue for this company is £12.5 million, of which £8.7 million comes from just 20 customers. Talk about the 80:20 rule in action!
The sales manager in this business has set the classification bands as follows: >£300,000 for a Platinum customer, £125,000 to £300,000 for Gold and so on (see table below).
Mapping the 210 customers into the framework provides a fascinating insight into how many fit into each category. There are 10 Platinum customers, 10 Gold customers, and 69 Silver customers; 121 customers are classified as Bronze, delivering less than £25,000 per annum. That’s a significant tail.
| Classification Band | Classification Band value of total annualized revenue | Numbers of customers based on previous year’s annualized revenue |
| Platinum | £300> | 10 |
| Gold | £125k to £300k | 10 |
| Silver | £25k to £125k | 69 |
| Bronze | <£25k | 121 |
Your customer classification will help create clarity and focus on your sales priorities by highlighting which customers should get the maximum focus of your retention efforts. It will enable you to proactively manage and reduce your risk and exposure to customer concentration risk (platinum customers) and it will help you target your cross selling initiatives to those mid-tier customers (silver and gold) with the aim of moving them up the bandings.
By understanding your revenue gap (step 1) and applying your customer classification (step 2) you’ll know what you need to deliver through new customer acquisition.
Looking for a way to secure your sales growth in 2019?
Use The Business Growth Pathway™ Sales Strategy tool for FREE to idenitfy key focus areas for your business in less than 30 minutes.
Get Started
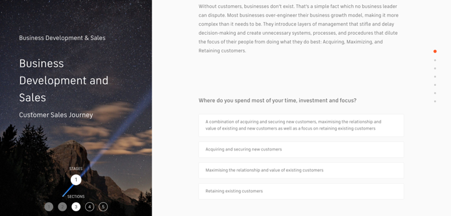
Step 3: Customer Segmentation
Having classified your customers in revenue / value bandings the next step is to segment your customers into similar groupings. This could be based the products and services they buy, their location, or their preferred contact channel.
Segmenting your customer base into similar groups will be you in a strong position to understand their similarities and differences (pains & gains), align appropriate resources to serve/acquire the customer segment, priorities the most profitable segments and tailor your offering accordingly.
The process of segmentation will allow you to deliver deliberate and targeted results to a particular segment.

Step 4: Proposition Matrix
Your proposition matrix will help you understand how to get your customers to buy more.
One in three customers do not buy your complete range of products and services simply because they do not know you offer them! Are you and your business unknowingly part of this statistic?
If I were coaching you and your team, one of the first exercises I’d ask you to complete would be to write down on piece of paper, in five seconds, a number that equates to the total number of products and services your customers can buy from you.
In nearly 20 years of doing this exercise, the response – 99.9% of the time – is the same:
I have yet to find an organisation with more than 20 people and more than 10 products and services where there is instant and unanimous agreement on the total numbers of products and services they offer.
If your team cannot quantify the precise number, who else can’t? Your customers! The number one reason customers do not buy ALL of your products and services is that they simply don’t know you sell them. Now, whilst being a challenge it also offers one of your greatest opportunities for creating accelerated growth.
- Have you ever come away from a customer meeting and thought, ‘I should have asked about . . .’?
- Have you ever had a customer tell you they’ve bought a product or service from someone else, which they could have bought from you?
- Are you missing sales, and cross-selling opportunities of products and services, to current customers?
- Do you have a process to educate and up-sell to customers your full value proposition of products and services?
If you answered yes to any of the first three questions and a resounding no to the fourth, then you’ll find enormous benefit in the Proposition Matrix. The Proposition Matrix is a success formula that guarantees you and your people will consistently educate your customers on your full range of products and services.
Imagine a grid, a chess board, and list all your customers on the vertical axis and all your products and services on the horizontal axis. Then colour in the meeting square where the customer currently buys your product or service. The squares that remain uncoloured are your ‘opportunities’, and through an ongoing process of educating and engaging with your customers on those open spaces, you can start to maximise and unlock the potential in your existing customer base. Education and engagement can be achieved through face-to-face contact, email marketing, direct mail and telesales, or any number of other media.
There are differing surveys, articles, and expert opinions on the frequency with which customers need to see or hear about your business in varying forms. However, the underlying message is the same: the process of education and engagement never stops.

Step 5: Customer Potentiality
Potentiality is your ‘acres of diamonds’, the potential growth lying dormant or hidden within your existing customer base. You’ve already invested the time, effort, and money to acquire them; are you maximising the benefits of that investment through proactively managing and developing the relationship?
I have helped organisations understand the concept of potentiality over the past two decades, and I have never seen a business where their potentiality isn’t at least double the current revenue. This is especially true for mature businesses. Often it is much higher. Very few companies have maxed out the potentiality of their customers and acquired all of their customers’ business.
In your customer classification framework (step 2) you can introduce a potentiality rating for each customer. Once you understand the potentiality of your customers, I guarantee you will have Silver customers who could be converted into Gold and Gold customers who could be converted into Platinum and so on.
| Classification Band | Classification Band value of total annualized revenue | Numbers of customers based on previous year’s annualized revenue | Profitability (Average gross profitability by band) | Potentiality what’s the potential value through proactive maximisation? |
| Platinum | £300> | 10 | 42% | 5% of existing relationship |
| Gold | £125K to £300k | 10 | 63% | 10% of existing relationship |
| Silver | £25K to £125K | 69 | 55% | 15% of existing relationship |
| Bronze | <£25K | 121 | 28% | 1-2% of existing relationship |
Step 6: Cost to Serve / Acquire
Using your insight from steps 1 – 5, you can calculate how much it costs to serve your existing customer base and what are you prepared to spend on sales and marketing to acquire new customers.
The competitive and challenging business landscape has definitely focused the minds of sales professionals to interrogate their cost base and understand the cost / profitability of their customers more than ever.

Step 7: Customer Contact
There are two key considerations when designing customer contact strategy.
The first: what is your approach to customer relationship Management? If you operate B2B, who are the key contacts in the customer business that you need to foster and develop relationships with and vice versa – who are they aligned and backed off against in your business? The breadth and depth of contacts are critical in both businesses. If you only have one contact in the customer organisation and that contact leaves, not only do you lose that personal relationship, but also the entire relationship between your two businesses could be at stake.
Similarly, if you only have one person in your business managing all your key customer relationships, you face a major risk if they leave. Especially if they move to a competitor.
The second consideration: ensuring there is an effective schedule of contact between members of your business and your assigned customer contacts ensuring you keep up to date about potential changes they may be considering and can work those into your plans. There are few things more wasteful than a customer who silently defects to another supplier entirely without your knowledge, because you didn’t have open dialogue.
A fundamental design principle of your customer contact strategy is having a real understanding of the cost to serve by customer versus their annualised revenue contribution, profitability and potentiality. To help you do this, add in two additional columns in your customer classification framework (step 2) to cover customer relationship and customer contact.
So for example, you might have a Platinum customer who requires regular face-to-face meetings, weekly calls, and exchange of emails. From a business perspective their value warrants this level of commitment to the relationship.
Unfortunately, in life he who screams loudest often gets the most attention. In business, the customers who often are the most demanding of your time are those in the Bronze band, the least profitable. Without an effective customer contact strategy, the risk is that you respond to your Bronze customer in exactly the same way as your Platinum customer, giving them a disproportionate amount of your time compared to their value.
Let me be clear, this doesn’t mean Bronze customers aren’t important, or that you shouldn’t strive to provide them with an excellent service. It’s about assessing whether it’s commercially viable and sustainable to give them the same level of service as a Platinum customer.
Step 8: Sales Mapping
In sales, predictability is everything. Your ability to predict your sales results with a high degree of confidence is critical to keeping your entire business growth strategy on track. Culturally the one thing people dislike in sales is surprises. You see what happens to share prices when profit warnings are announced – they become extremely volatile.
The purpose of the sales map is to ensure there are no surprises coming from your sales strategy. Instead you deliver predictable, repeatable, sustainable results every time.
Think of the Sales Map as your satellite navigation. When you set your satellite navigation device, what is the first piece of information you type in? The destination, of course. The end point. The goal. And in understanding your current position, it is able to set a route for you to follow. You are immediately given all the information you need, including the time to the destination and the distance. It might even give you different route options in terms of the route you can take: major roads only or direct as the crow flies, taking in every minor road on the journey.
When you start the journey at any given point you have real time data in terms of your position. If there are road works, traffic jams, or obstacles ahead it proactively informs you, giving you options on alternative routes. It is an intelligent, dynamic system, putting you the driver 100% in control.
Your sales map is your satellite navigation device for your business. You set the destination, type in the critical data, and the intelligent dynamic tool does the rest. Its job is to get you where you want to go in the best possible way and in the optimum time. Let’s look at how it works.
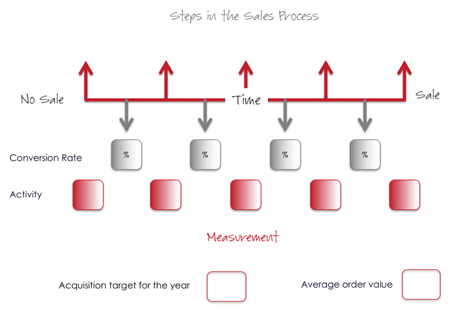
The horizontal line represents time from No Sale to Sale. This is important, since knowing your average timeline from ‘initial enquiry’ to ‘business won’ is critical. For some businesses, it can be instant; for others it can be months or even years.
Why is the timeline critical? If your goal is to deliver £1 million, £10 million, or £100 millions of ‘realised’ revenue then the definition of ‘Sale’ and the timeline become really important.
For example, the key sales period for a gym is January, what with the New Year’s blues and all the well-intentioned goals people have at that time of the year! Let’s imagine the gym wants to acquire 500 new members in the month, but only achieves a target of 300. For every month that ticks by during which it doesn’t make up the 200 member shortfall, it loses incremental realized sales of 1/12th, which creates pressure to make up the ‘gap’ by having to increase the number of members month on month.
If you win a customer at the start of the year, you will realise the full value within the year. However, if you only win the customer at the half-year mark, their contribution to the overall sales target for the year might only be £25K. In your planning and forecasting, therefore, the timeline impacts the personalisation of your sales map.
From No Sale to Sale you need to capture the critical steps in your sales process. Not about every call, every ring back, or relentless follow up just those key steps to get you from no sale to sale.
Below the ‘time’ line, there are two key elements; the conversion rates for each step in the process and the activity required at each step.
I have worked with very few businesses who track their overall sales conversion from No Sale to Sale, let alone conversion rates at each step in the process. Yet measuring this accurately is essential if you want to be truly world class at pipeline management and have certainty in your planning and forecasting.
By measuring the conversion rate of each step, you can deep dive into what is working and where blockers might exist. For example, skills and capability gaps of individuals who may be struggling with one particular step.
The second element is activity, the important part from a pipeline management perspective. The science behind the Sales Map will give you the activity required in order to deliver your overall sales plan for the year.
As a worked example, let’s use a Sales Map for the £1 million revenue company we used earlier in step 1 (sales planning) From the earlier example we calculated that to deliver a 10% growth to £1.1 million, the acquisition/new business target for the year needed to be £300,000. You’ll see 300K inserted in the left hand box at the base of image…
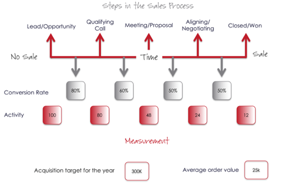
The next critical question: what is your average order value? Note the term ‘average’. This is your mean average if you take out any one-off big deals or small deals, which might distort the figure. For this example, I’ve used a hypothetical figure of £25,000.
So based on an acquisition goal of £300,000 and an average order value of £25,000 you would need to acquire 12 deals this year, represented by the 12 inserted in the box on the right hand side of the Sales Map beneath the closed/won stage.
Now you might have already picked up that we’re approaching this from an unexpected direction. When I do live coaching sessions with the Sales Map and ask the audience where they think the starting point is for personalising the Sales Map tool: No Sale or Sale, 90% will default to No Sale. Wrong! If we are proactive in our planning and forecasting and we know where we want to be by the end of the year, we should work backwards to identify the activity required at each step to get us to our end goal.
So, having calculated the number of closed/won deals, the next step is to decide what you think the conversion rates are going to be at each step in the process. You may not be 100% certain about this and may have to present your best guess, gut feel, or intuition, but that’s ne . . . we can work with that. The key is to use some baseline assumptions and then, over the course of time, validate whether they are reality or whether adjustments need to be made. The great thing about Sales Mapping is that it is a dynamic, fluid tool, which you can adjust as your insight and empirical evidence develop.
Finally, once you have inserted the conversion rates, you can calculate the activity required at each step in the sales process. To deliver £300,000 of new business, with an average order value of £25,000, equating to 12 new deals based on the conversion rates at each of the four steps, you will need 100 new leads/opportunities.
Now, our final challenge is identifying how to source those 100 leads/opportunities, which brings me to our final step.

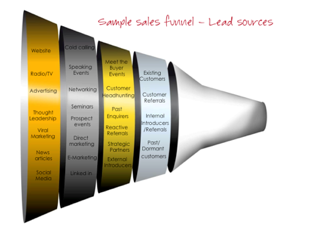
Step 9: Sales Funnel
Your sales funnel plugs into your sales map, acting as the feeder of quality opportunities. The science behind the sales map will drive the total number of quality opportunities required (100 in our example). The question is where are they going to come from?
Your sales funnel enables you to track where potential sales are initiated from, and how they are progressing according to your sales activities. It is an invaluable tool because it delivers insight into:
- Which of your sales and marketing activities are effective, both from an overall perspective and from a tactical perspective
- Which of your sales activities related to those marketing activities are working and the effectiveness of the results of each
- The number of prospects that enter the funnel and which result in closed sales
- The strength and weakness of the sales strategy in driving prospects through the funnel and turning them into customers
- The strength and weakness of individual salespeople.
The funnel is divided into four categories (see image below) The first tier nearest to the tip of the funnel corresponds to the most effective strategies: the low hanging fruit and optimum lead generation.
Working back through the three remaining tiers are strategies that you can use in your personalised lead generation model. There are hundreds of ideas that could be in here and some will depend on what works in your business and for your customer type. The purpose here is to seed the sense of possibilities, to give a structure to what and how you subsequently develop your lead generation activity.
Why your sales strategy needs to work hand in hand with your marketing and product strategies?
There is an obvious overlap between your Sales Funnel and your marketing strategy.
The interdependency between marketing and sales becomes apparent when your sales teams have identified the lead generation activities they need to undertake, and marketing take these ideas and turn them into targeted and meaningful campaigns.
Clearly, the return on investment from a particular campaign must be quantifiable and this is usually where positive tensions between sales and marketing arise. Working together will ensure both sides understand each other’s perspective, but ultimately understand that everyone is working towards the same goal.
Creating a Successful Sales Strategy
If you've read this far then it's becuase you are committed to developing a sales strategy that is really going to help you grow your sales and your business.
This year I took everything I learned through my own business experience (plus two decades of high-profile business growth consultancy) and distilled it into The Business Growth Pathway™ - a digital platform that gives you a comprehensive assessment of your sales strategy and identifies key areas for you to focus on.
You can get started now or read on to see how it works.
You begin by creating your sales strategy with an intuitive in-depth online tool that drills into the key areas of your sales strategy…
…by asking you a multitude of questions…
…in order to create your sales strategy for 2019 and the priority areas you should be focusing on to turn 2019 into your best year yet.
The impact to your bottom line is real…
"We’ve seen a 32% increase in revenue and reduced our fixed costs by 20% since using the Pathways framework. The insights, data and personalised blueprint have been invaluable for my business."

Get a FREE custom sales strategy PDF for your business in less than 30 minutes.
- Set up your account
- Complete the BD & Sales questionnaire
- Based on your answers, our algorithm will assess your answers and provide you with a comprehensive, sales and business development report highlighting what your need to do to improve your sales in 2019.